Marine bioeroder and anthropogenic impacts on the carbonate budget in Pulau Tioman
Abstract
Pulau Tioman is a Malaysian island widely known for its tourist-enticing coral reefs. Four sites across four days were surveyed to assess the carbonate budget on Tioman. We found our average net carbonate budget to be a +6.91 kg/m2 /year and not significantly different across our four sites. We found an inverse relationship between the abundance of parrotfish and urchins, and our data suggests that anthropogenic activities may have played a role in where parrotfish or urchins dominate. Furthermore, we found that with a higher abundance of parrotfish, there is a higher carbonate budget. This calls into question the binary nature of classifying organisms included in carbonate budget calculations as either carbonate producers or bioeroders.
Introduction
The carbonate budget is the sum of carbonate production rates from corals and encrusters minus the carbonate eroded by certain species of fish, urchins, and macro- and micro-borers (Perry et al., 2012). A net positive carbonate budget indicates carbonate accumulation which results in coral accretion, while a net negative budget suggests an erosional state. Monitoring a reef’s carbonate budget can give insight on the coral reef’s health and can provide vital information that could potentially help restore a reef after events of coral bleaching which will become more common with ocean warming and climate change (Januchowski-Hartley et al. , 2017). A thriving reef is not only a plus for ecological health, but also for the tourist economic sector of Tioman (The Editors of Encyclopaedia Britannica, 2011).
Parrotfish (Scaridae) and urchins (Diadema) take refuge in and erode coral reefs, reducing the carbonate budget (Mumby, 2006). It is also known that human activities (e.g., diving and snorkeling) play a role in coral reef destruction (Antonius, 1981). Here, I investigate the impacts of marine bioeroders, predominantly parrotfish and urchins, as well as divers/snorkelers on the carbonate budget on Pulau Tioman. Studying these tourists’ impact on reefs can lead to the implementation of necessary regulations for divers and snorkelers to promote both an increase in responsible tourism and healthy reefs in Tioman.
Material and Methods
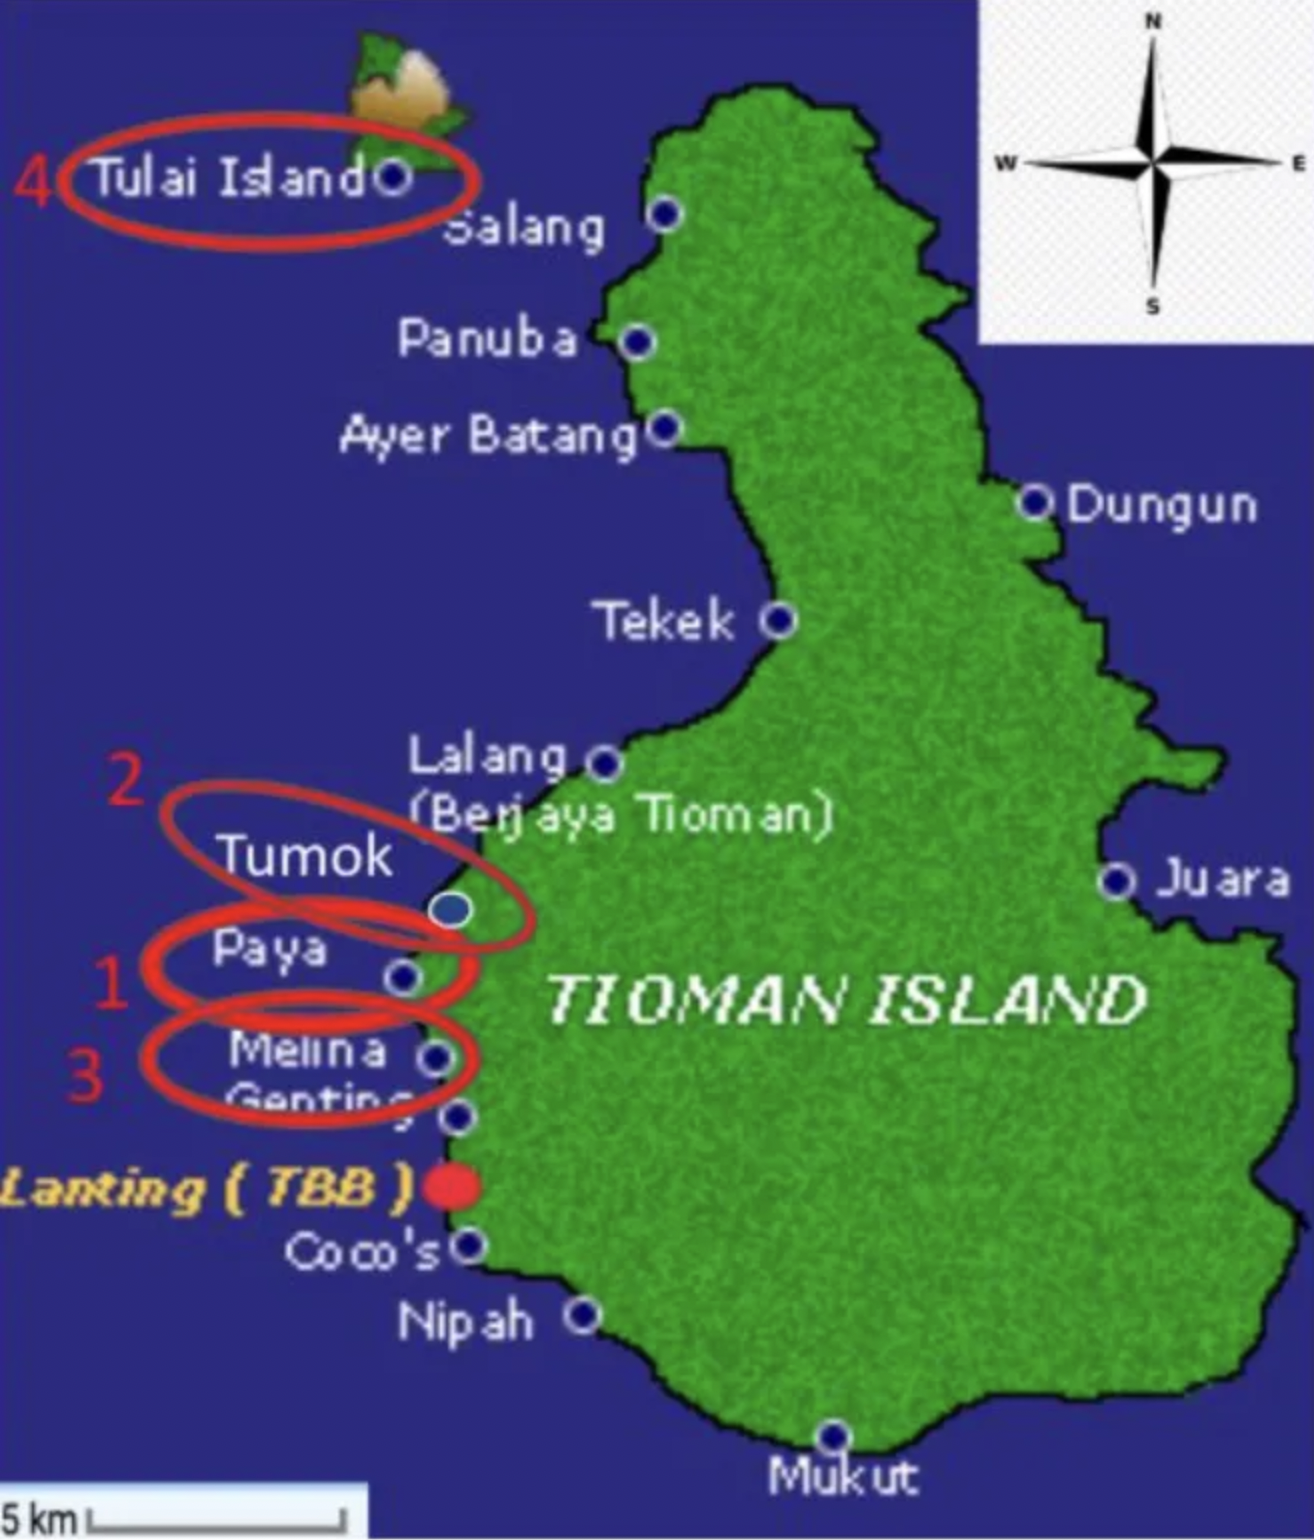
In this experiment, we calculated and compared the carbonate budget at four different sites on Pulau Tioman: 1)Paya, 2) Tumok, 3)Melina, and 4)Tulai (figure 1).
The carbonate budget at each site was calculated using the ReefBudget approach adapted for use on Indo-Pacific reefs(Perry et al. , 2015) by acquiring data from carbonate producers (corals) and eroders (parrotfish and urchins). The coral carbonate production was calculated by determining the abundance of corals using line intercept transects(LIT). At each of our 4 sites, 18 transect lines of 30 meters each were used. Each site was split into 6 sections and 3 transects were laid using a compass in each section. Corals were identified on our transect lines to the genus level, similarly to other studies(Januchowski-Hartley et al., 2017), as to avoid incorrect identification of species. Additionally, coral growth forms were identified i.e branching, tabling, etc. Soft corals, sponges, and sea anemones were not documented on our transect lines and instead were classified as “other” as they do not produce carbonate.
On each transect, point intercept transects(PIT) were used by looking at a total of 31 points at each meter to measure rugosity. A scale that provided a ranking system for reef complexity and height at each of these 31 points scale was used (Darling et al., 2017). The scale ranged from 0–5, 0 being the least complex(a flat sand and rock surface) and 5 being the most complex(coverage and >1m tall).
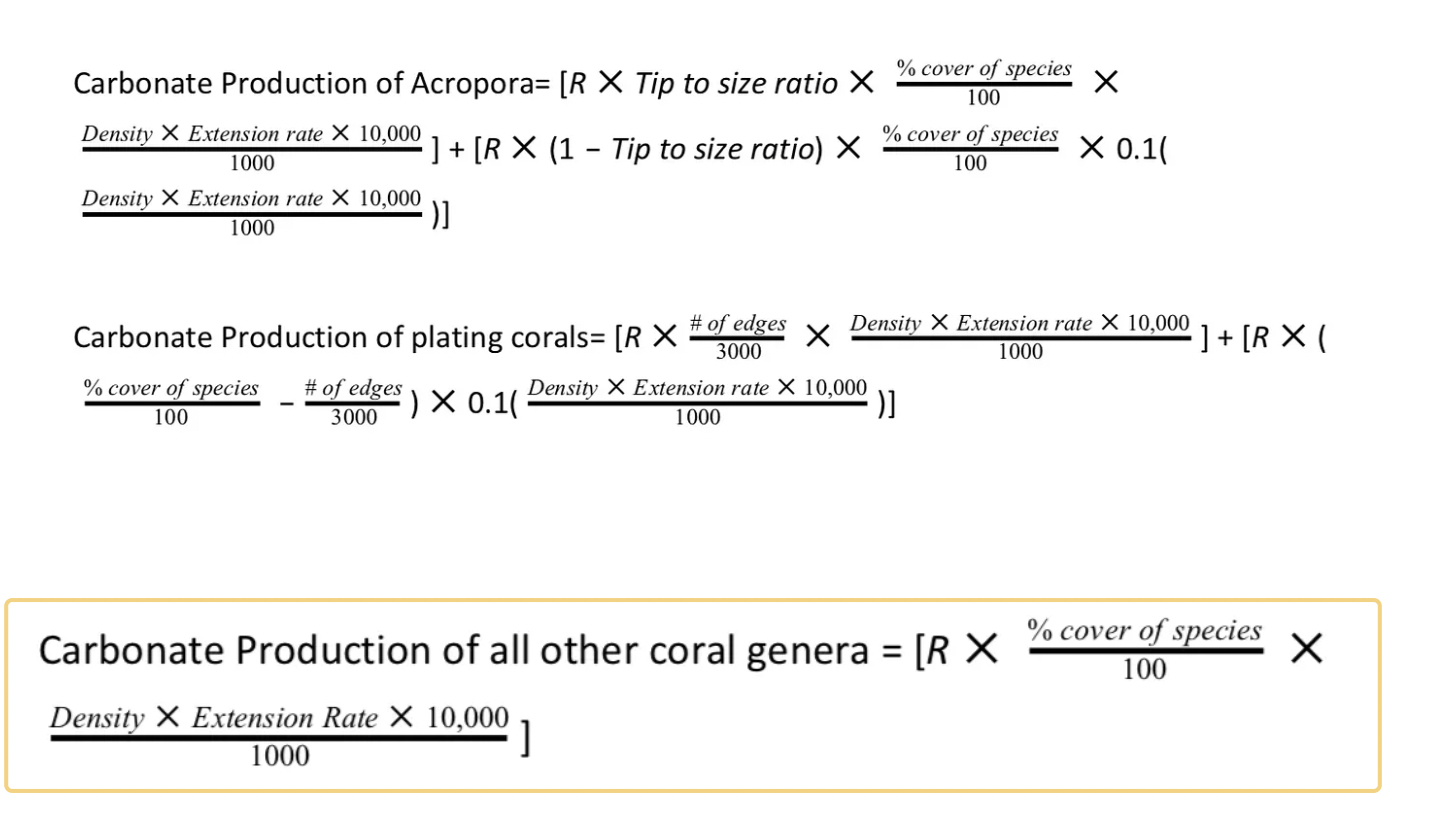
With the data collected, each documented coral information was input into the appropriate equation to calculate the overall coral carbonate production (Januchowski-Hartley et al., 2017). Three equations were used, one specific to Acropora sp., another for plating growth form coral, and one for all other corals (see appendix 2).
To calculate the carbonate erosion rates of parrotfish, a belt transect of 30x4m was used to count the abundance of parrotfish based on size classes and life stages. Fish were categorized based on life phase as initial, juvenile, or terminal. Though we did not identify the species of parrotfish due to their fleeting appearances, size was accounted for. An equation (Januchowski-Hartley et al., 2017) was used to calculate the carbonate erosion rate of parrotfish(see appendix 3).
To calculate the carbonate erosion of urchins, abundance and size data was likewise collected, but on a 30x2m transect belt. The urchins that were within our transect were counted, but only the genus Diadema since they make up the vast majority of the reefs we were surveying. Additionally, we determined the size of the urchin by estimating the body of the urchins. Spine length was disregarded because of high spine length variance in urchins which does not correlate to the amount they erode. An equation (Januchowski-Hartley et al., 2017) was used to calculate the erosion rate of urchins (see appendix 3).
Lastly, bioerosion rate values from previous studies (Januchowski-Hartley et al.,2017) were used to quantify our macroborers, such as clams and worms, and our microborers, bacteria, contribution to the carbonate budget (see appendix 4).
All of these values were summed (carbonate production of corals, parrotfish, urchin, macro, and microborer erosion rates) to get the gross carbonate budget. One-way ANOVA tests were run to determine if the carbonate budget, urchin, and parrotfish erosion rates were significantly different across our four sites.
To investigate the anthropogenic impact on carbonate budgets, the amount of swimmers at each site were surveyed during our carbonate budget data collection (~9am-2pm). Data was not collected from the local dive shops on the amount of customers they had because they did not keep records and despite a dive shop’s proximity to a certain beach, the dive guides alternate locations to beaches all over the island.
Results
1.Carbonate Budget
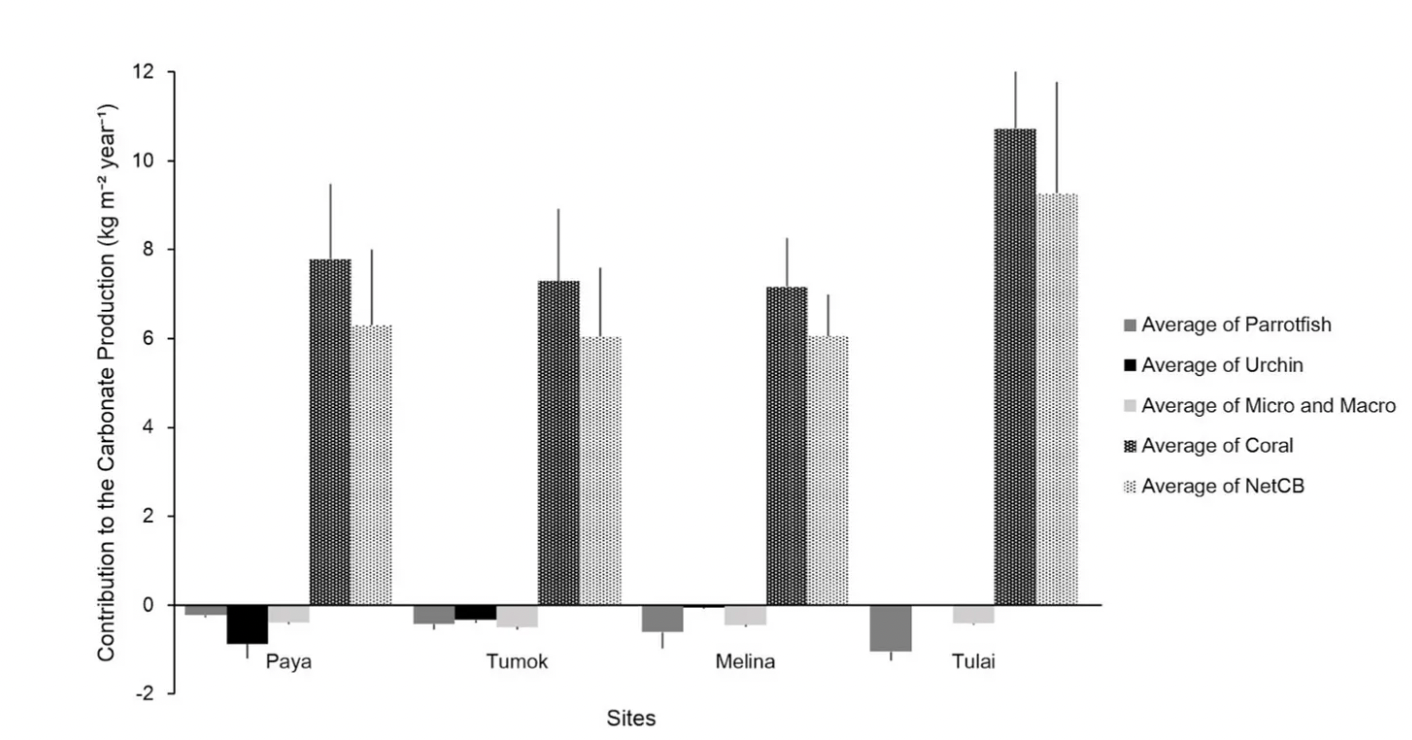
The average net carbonate budget across all 4 sites was 6.91G. All the reefs had a positive net carbonate budget (Figure 2). The average net carbonate budget per site had an ANOVA p-value of 0.505, thus there were no significant differences in net carbonate budget among the four sites.
Figure 2: Contribution to the carbonate production versus site. This graph shows the carbonate production rates from corals, carbonate erosion rates from parrotfish, urchins, micro and macro-eroders, and the net carbonate budget for each site. (One-way ANOVA coral production p=0.464, One-way ANOVA micro-borers p = 0.442, One-way ANOVA macro-borers p = 0.442)
Tulai had the highest carbonate budget at 9.26 G (G = kg CaCO3/m²/year). Paya had the second highest at 6.30 G, followed by Tumok with the third highest at 6.05 G, and Melina with the lowest carbonate budget at 6.04 G. Coral accretion was highest at Tulai and lowest at Melina. Macro and micro-bioerosion rates were similar throughout the reefs (Figure 2).
2. Parrotfish and Urchin Relationship
Additionally, an inverse relationship was observed between urchin (Figure 3) and parrotfish abundance (Figure 4) with correlating carbonate erosion rates (Figure 2). Urchin abundance (Figure 3) among sites show a decrease in the total number of urchins from Paya to Tulai, with Tulai having no urchins. Urchin bioerosion rate also follows a decreasing trend with Paya being the highest and Tulai the lowest.
Figure 3. Urchin abundance across sites based on size class (ANOVA p-value=0.00203)
Our data for urchin bioerosion(Figure 2) indicate that urchin erosion rates were significantly different among sites.
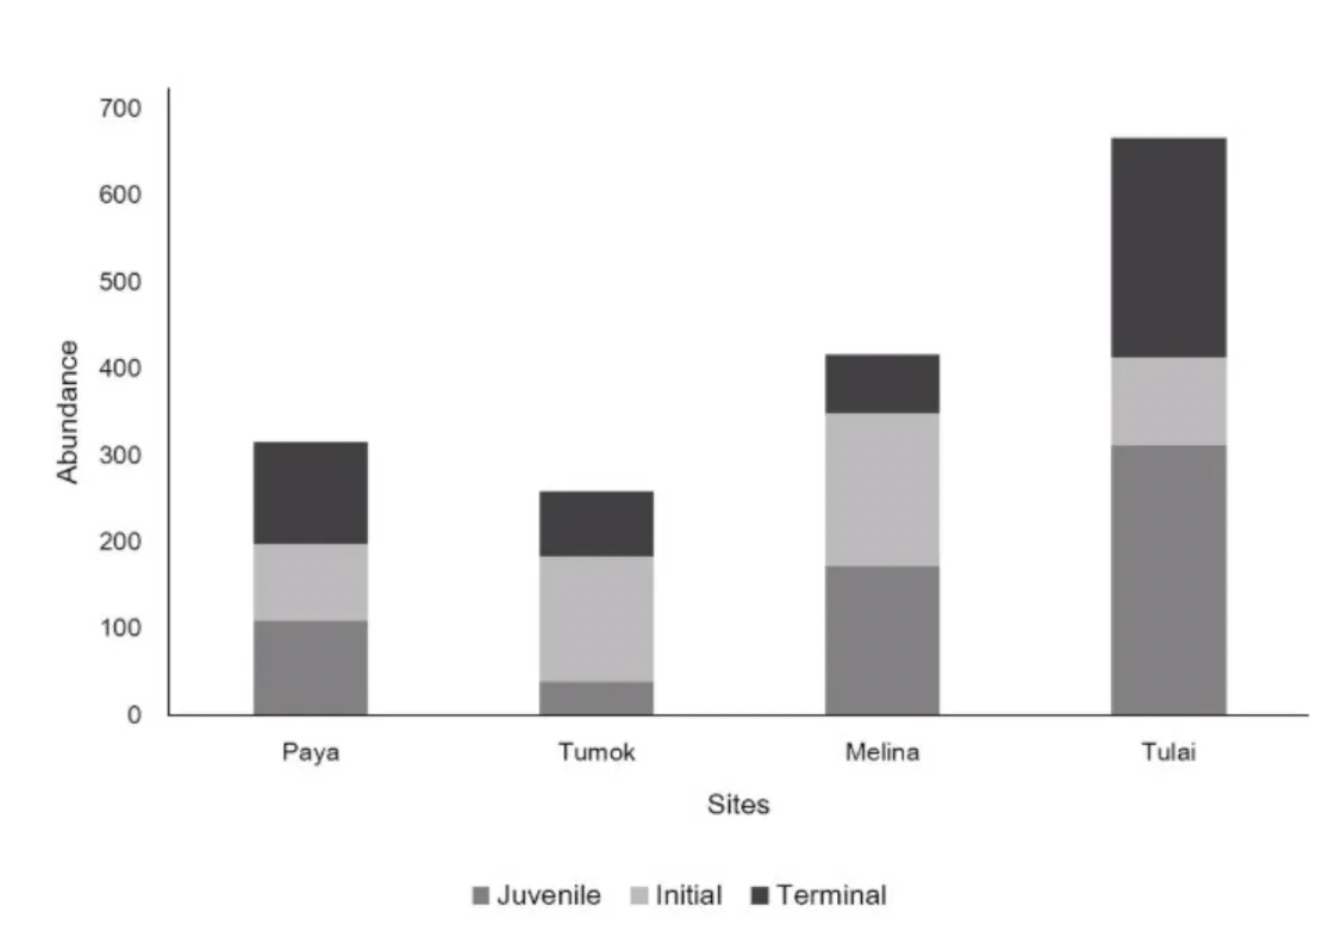
Figure 4. Parrotfish Abundance across sites categorized by life stages (ANOVA p-value=0.0632)
Parrotfish abundance among sites shows an increase in the total number of parrotfish from Paya to Tulai. Parrotfish erosion rates (Figure 2) among sites also show an increase from Paya to Tulai, however the parrotfish erosion rates are not significantly different among sites.
3. Anthropogenic Activity
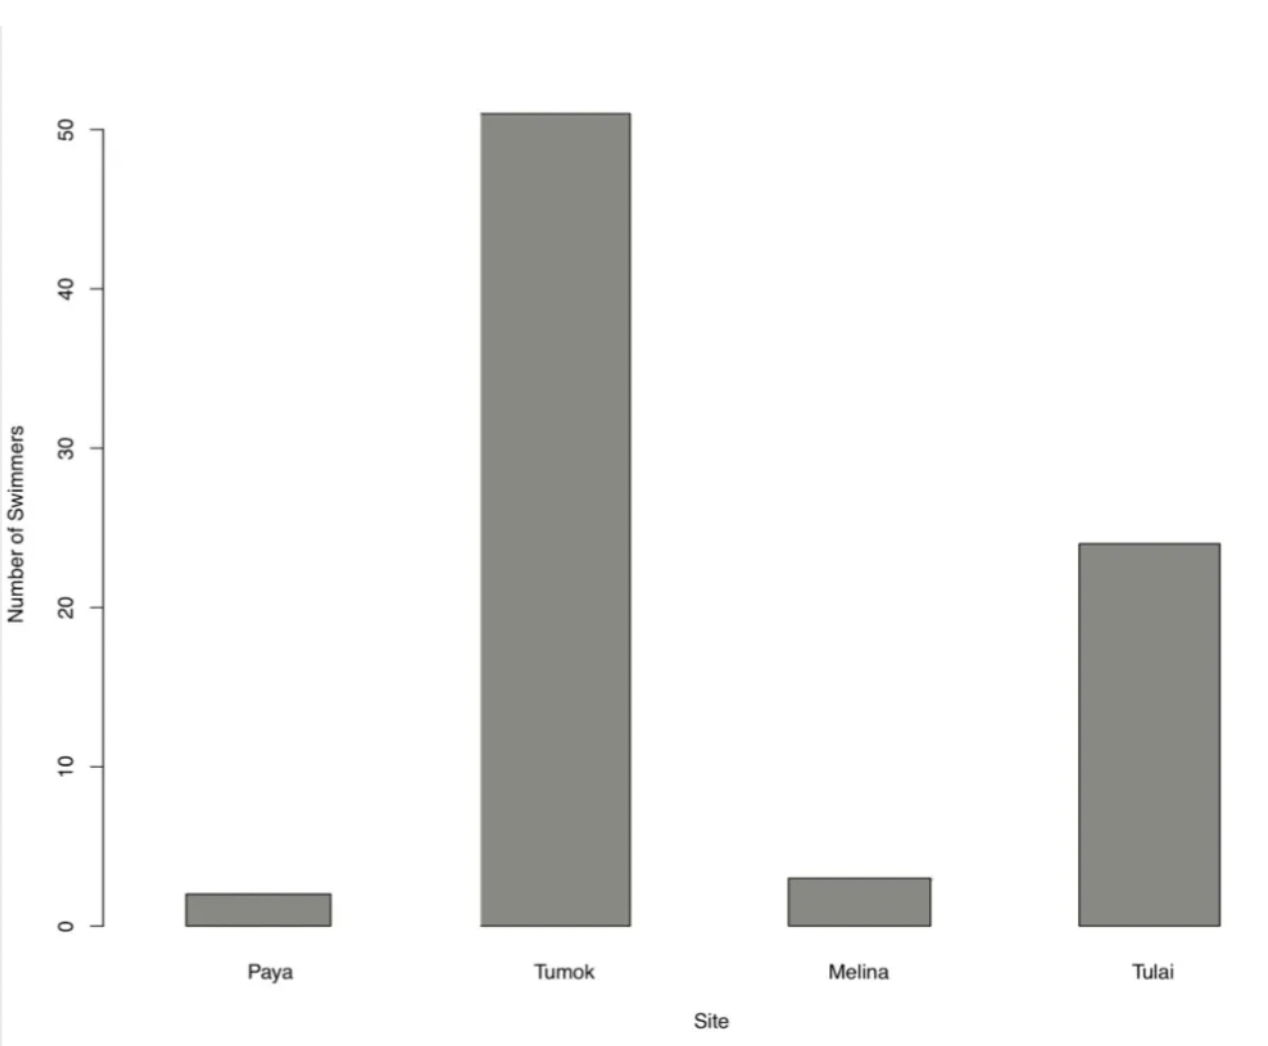
Figure 5. Number of Swimmers across Sites
Anthropogenic activity recorded from our one day survey at each site (Figure 5) showed that the most anthropogenically populated site comparatively was Tumok, followed by Tulai, then Melina and finally Paya.
Discussion
1.Carbonate Budget
Across all 4 sites, the net carbonate budget was positive and not significantly different.
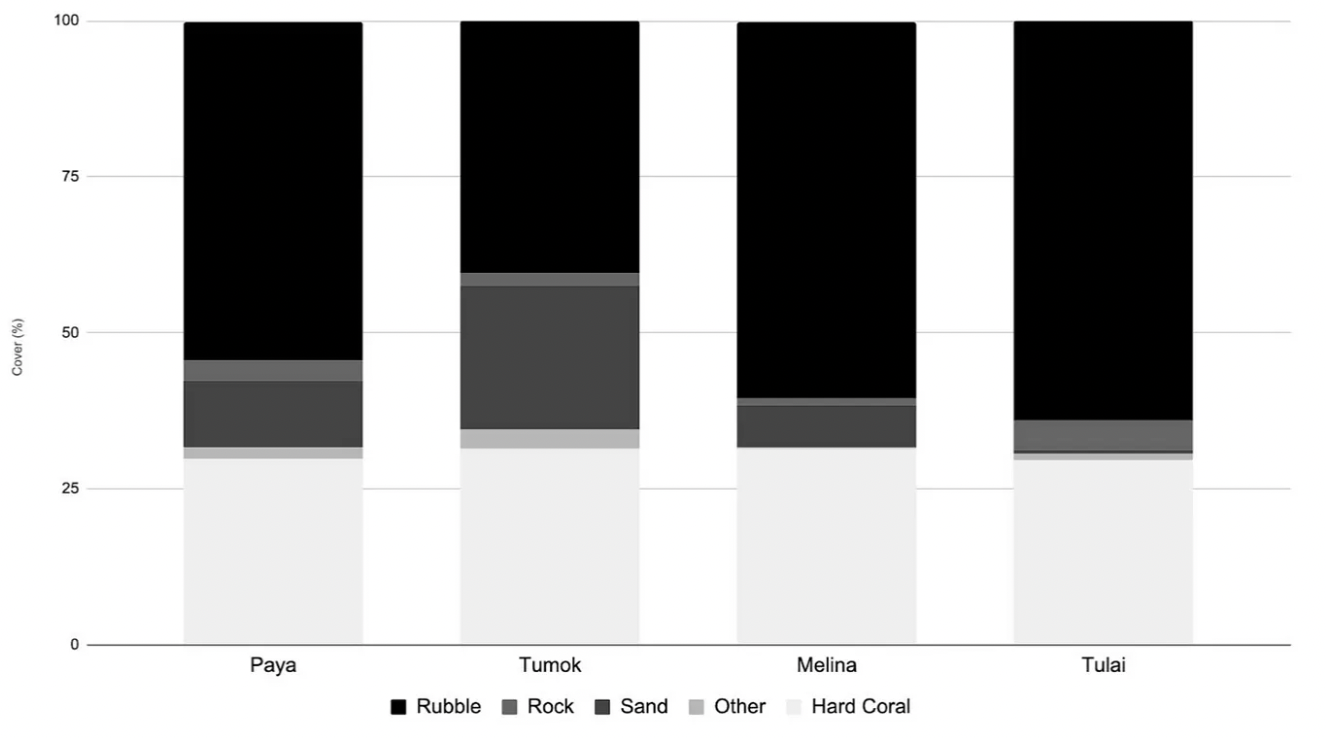
This makes sense as the percent cover of coral was also deemed not significantly different (see Figure 6 in Appendix 1). This similarity in carbonate budgets may have been due to our sites all being located on the west side of the island (Figure 1) and all sites being affected by similar stresses, i.e. anthropogenic activity. Tulai had the highest carbonate budget, and we speculate that this may be due to the isolated nature of the site. Tulai is ~5.5km away from Tioman’s mainland (Figure 1) and requires a boat ride to reach there. Even though there are anthropogenic disturbances at this site, its distance from the mainland may be an important factor.
2. Parrotfish and Urchin Relationship
We found that urchin bioerosion (Figure 2) was significantly different across sites. This may be due to the fact that there were no urchins in Tulai (Figure 3), affecting the p-value. In Tulai where there were no urchins present, there was the highest abundance of parrotfish present (Figure 4) and therefore had the highest parrotfish bioerosion rates (Figure 2). In Tumok, the least amount of parrotfish (Figure 4) and the most urchins (Figure 3) were seen. This inverse relationship between parrotfish (Figure 4) and urchins (Figure 3) is prevalent in our data. This relationship may be due to competition for resources and/or predator presence. Both parrotfish and urchins feed on macroalgae so they may be in competition for food resources. They have very different modes of locomotion — urchins are sessile while parrotfish have more freedom to move. This allows parrotfish to choose optimal locations for feeding and to avoid sites with the presence of predators and potentially outcompete urchins, while in other cases parrotfish may be driven away by predator presence or other disturbances allowing the urchins to propagate.
3. Anthropogenic Activity
The most anthropogenic presence was in Tumok, and the least human presence was seen at Paya (Figure 5). Tumok had the most anthropogenic disturbances, most urchins (Figure 3) and least parrotfish (Figure 4). It may be that the human water activities drove the parrotfish away, allowing urchins to increase in numbers as they didn’t have to compete for macroalgae resources. Additionally, the urchins may be propagating in an area rich with anthropogenic disturbances due to their defensive spines rendering humans nonthreatening.
These results, however, may have been affected by not standardizing for increased popularity of water activities on weekends or during the summer. Tumok, our most anthropogenically popular site, was surveyed on a Saturday which may have inflated our data. We additionally had a small sample size, did not take into account the weather conditions, nor the choppiness of the waves which could have affected the amount of people in the water. More data needs to be collected in the future to more accurately represent the anthropogenic disturbances.
4. Potential confounding variables
Parrotfish and worms are classified with urchins and micro and macro-borers as strictly bioeroders. However, their relationship with the carbonate budget may be more involved. Several studies explain the complex relationship of algae, parrotfish and coral health. Parrotfish actually help increase the carbonate budget instead of lowering it because they eat away at the macroalgae. This is beneficial for corals because this macroalgae is essentially starving the corals of energy by blocking the coral from sunlight (Cramer et al. , 2017). Additionally, some worms that are classified as macro-borers and bioeroders according to carbonate budget calculations may help corals more than originally assumed. For example, though Christmas tree worms (Spirobranchus giganteus) live in corals, they may prevent the growth of parasitic sponges that kill corals (Hoeksema et al., 2016).
In conclusion, the bioeroders (parrotfish and macro-borers) used to calculate the carbonate budget may be confounding. In the future, categorizing certain bioeroders differently to take into account that they may also contribute positively to the carbonate budget may result in a more accurate calculation of the carbonate budget. Additionally, more research needs to be done on anthropogenic disturbances influencing the carbonate budget as this research suggests that human activity actually does play a role in the sites that parrotfish and urchins are present, therefore impacting carbonate erosion rates and the overall carbonate budget.
Reference List
Antonius A (1981) Coral reef pathology: a review. Food and Agriculture Organization of the United Nations Proc. 4th Int. Coral Reef Symp., 2: 3–6.
Cramer KL, O’Dea A, Clark TR, Zhao J & Norris RD (2017) Prehistorical and historical decline in caribbean coral reef accretion rates driven by loss of parrotfish. Nature Communications, 8: 5–6.
Hoeksema BW, Hove HA & Berumen ML (2016) Christmas tree worms evade smothering by a coral-killing sponge in the Red Sea. ResearchGate Marine Biodiversity, 46: 15–16.
Januchowski-Hartley FA, Graham NAJ, Wilson SK, Jennings S & Perry CT (2017) Drivers and Predictions of Coral Reef Carbonate Budget Trajectories. Proceedings of the Royal Society B: Biological Sciences, 284: 253–269.
Mumby PJ (2006) The impact of exploiting grazers (Scaridae) on the dynamics of Caribbean coral reefs. Ecol Appl, 16: 747–769.
Perry CT, Edinger EN, Kench PS, Murphy GN, Smithers SG, Steneck RS & Mumby PJ (2012) Estimating rates of biologically driven coral reef framework production and erosion: a new census-based carbonate budget methodology and applications to the reefs of Bonaire. Coral Reefs Report, 31: 853–868.
Perry, C. T., Murphy, G. N., Graham, N. A., Wilson, S. K., Januchowski-Hartley, F. A., & East, H. K. (2015) Remote coral reefs can sustain high growth potential and may match future sea-level trends. Scientific reports, 5: 1–6.
The Editors of Encyclopaedia Britannica (2011) Tioman Island. Encyclopaedia Britannica, inc. https://www.britannica.com/place/Tioman-Island (Accessed 30 July, 2019).
Appendix
1. Percent coverage of Coral
The percentage hard coral cover among sites is relatively similar (30–31%). Composition of substrate such as sand, rock, rubble and other organisms varied. For instance, Tulai had the most rubble (64%) and Tumok had the least rubble (40%).
Figure 6. Percent Cover of Substrate at Each Site
2.Carbonate Production Equations
R represents the rugosity we found, and percent coverage was the percentage of that specific coral genera we found on our transects. The tip to size ratio, Density, and Extension rate values were extrapolated from previous studies (Januchowski-Hartley et al.,2017).We integrated tip to size ratio to account for coral growth being concentrated most at their tips.
3.Carbonate erosion rate of parrotfish equation:
Carbonate erosion rate of parrotfish= Σsp ((((Br ✕ % Bls ✕ Me) ✕ nsp) ✕365)/ 1, 000)
Br refers to the bite rate of parrotfish, %Bls refers to bites leaving scars, and Me refers to mass(g) eroded per bite. All of these values are from literature(Januchowski-Hartley et al.,2017). nsp refers to the fish abundance that we recorded.
4. Carbonate erosion rate of urchins equation:
Carbonate erosion rate of urchins= Σs (0.000001x3.4192 ✕ ns ✕ 365)/1000
x refers to the mean of the urchin size class and ns refers to the abundance of urchins (# urchin/(30 m x 2 m)).
5. Coral erosion rates of micro and macroborers
Coral erosion by macroborers = S ✕ R ✕ 0.261
Coral erosion by microborers = S ✕ R ✕ 0.055
S represents percent coverage of coral and R represents rugosity.
Figure 1. Map of Tioman Island and our 4 sites: 1) Paya 2) Tumok 3) Melina and 4) Tulai
Figure 2: Contribution to the carbonate production versus site. This graph shows the carbonate production rates from corals, carbonate erosion rates from parrotfish, urchins, micro and macro-eroders, and the net carbonate budget for each site. (One-way ANOVA coral production p=0.464, One-way ANOVA micro-borers p = 0.442, One-way ANOVA macro-borers p = 0.442)
Figure 3. Urchin abundance across sites based on size class (ANOVA p-value=0.00203)
Figure 4. Parrotfish Abundance across sites categorized by life stages (ANOVA p-value=0.0632)
Figure 5. Number of Swimmers across Sites
Figure 6. Percent Cover of Substrate at Each Site
